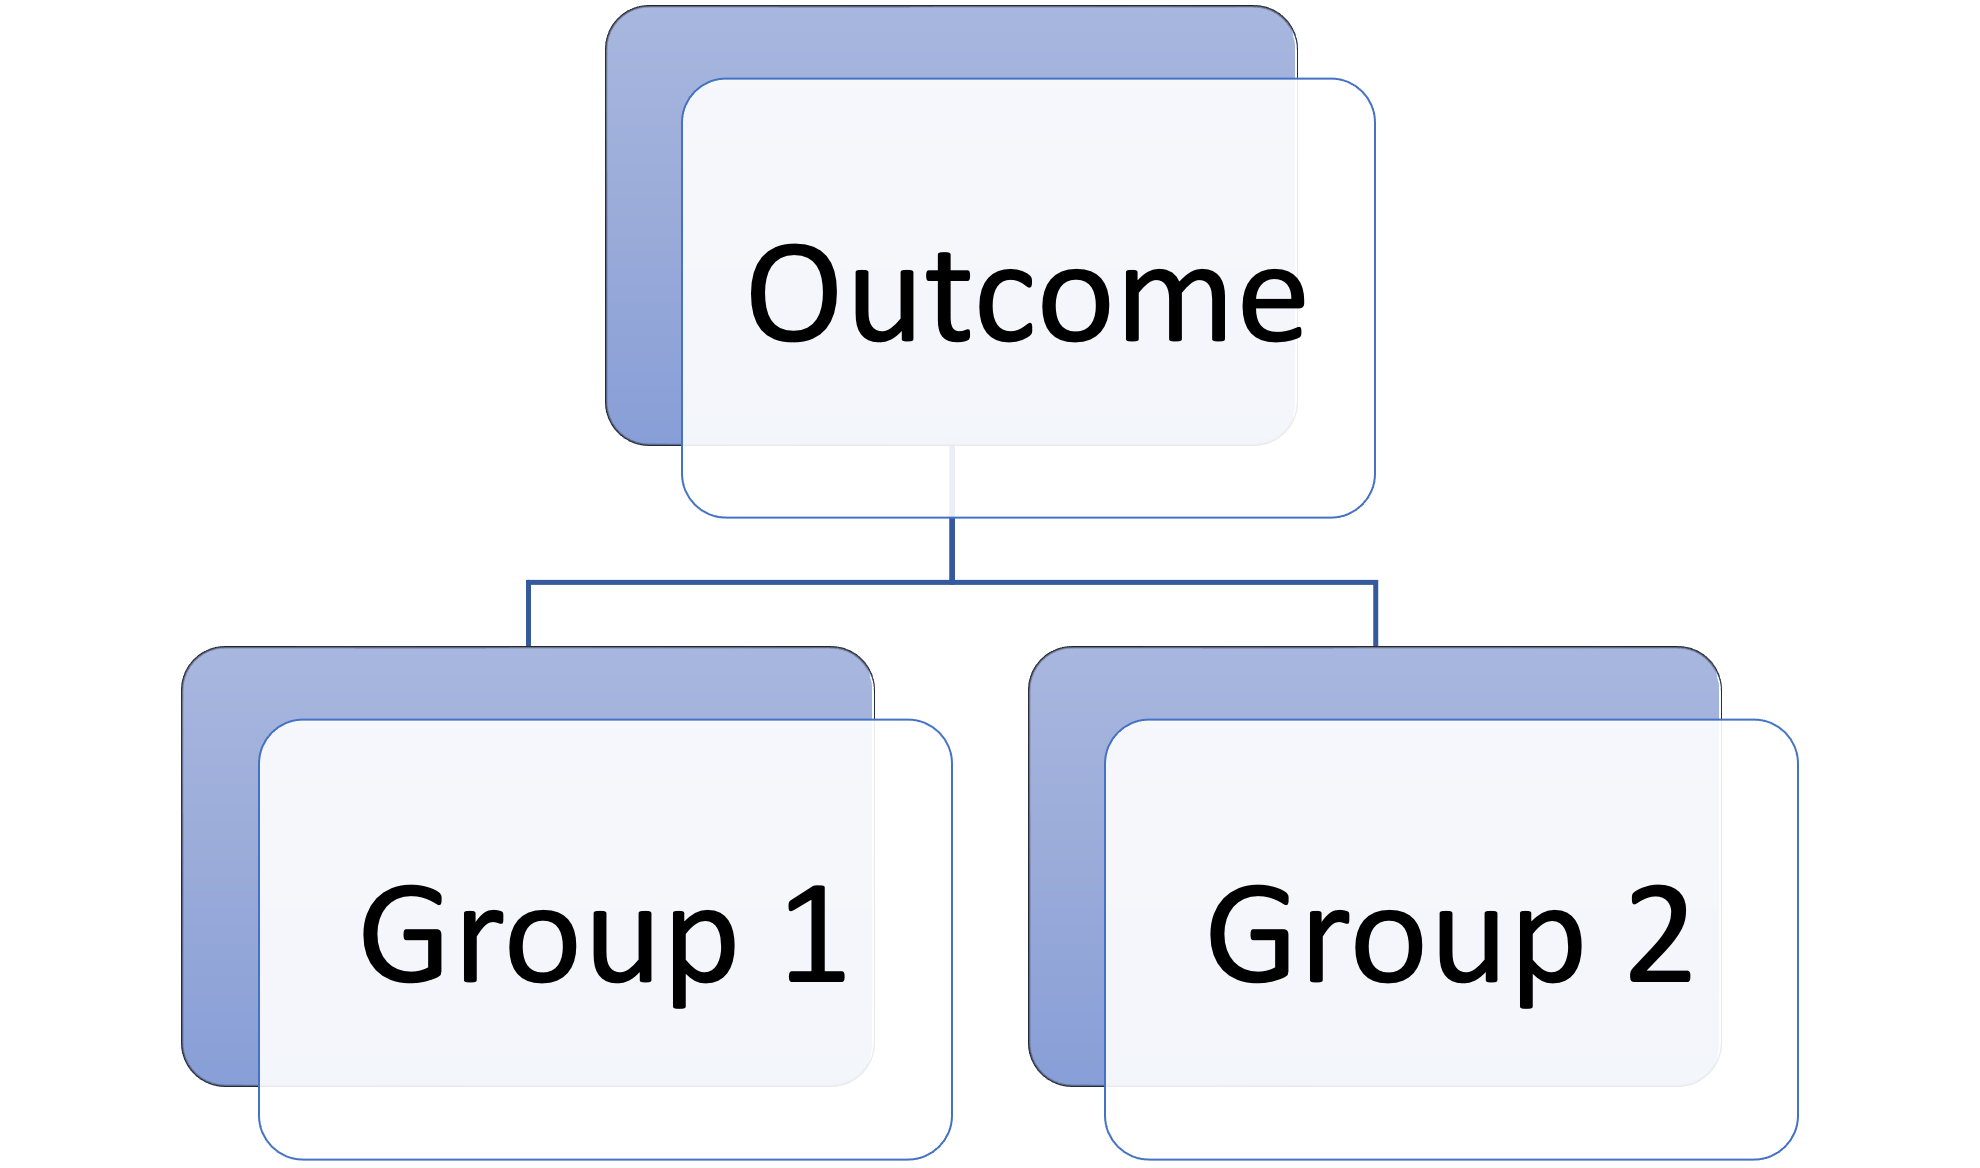
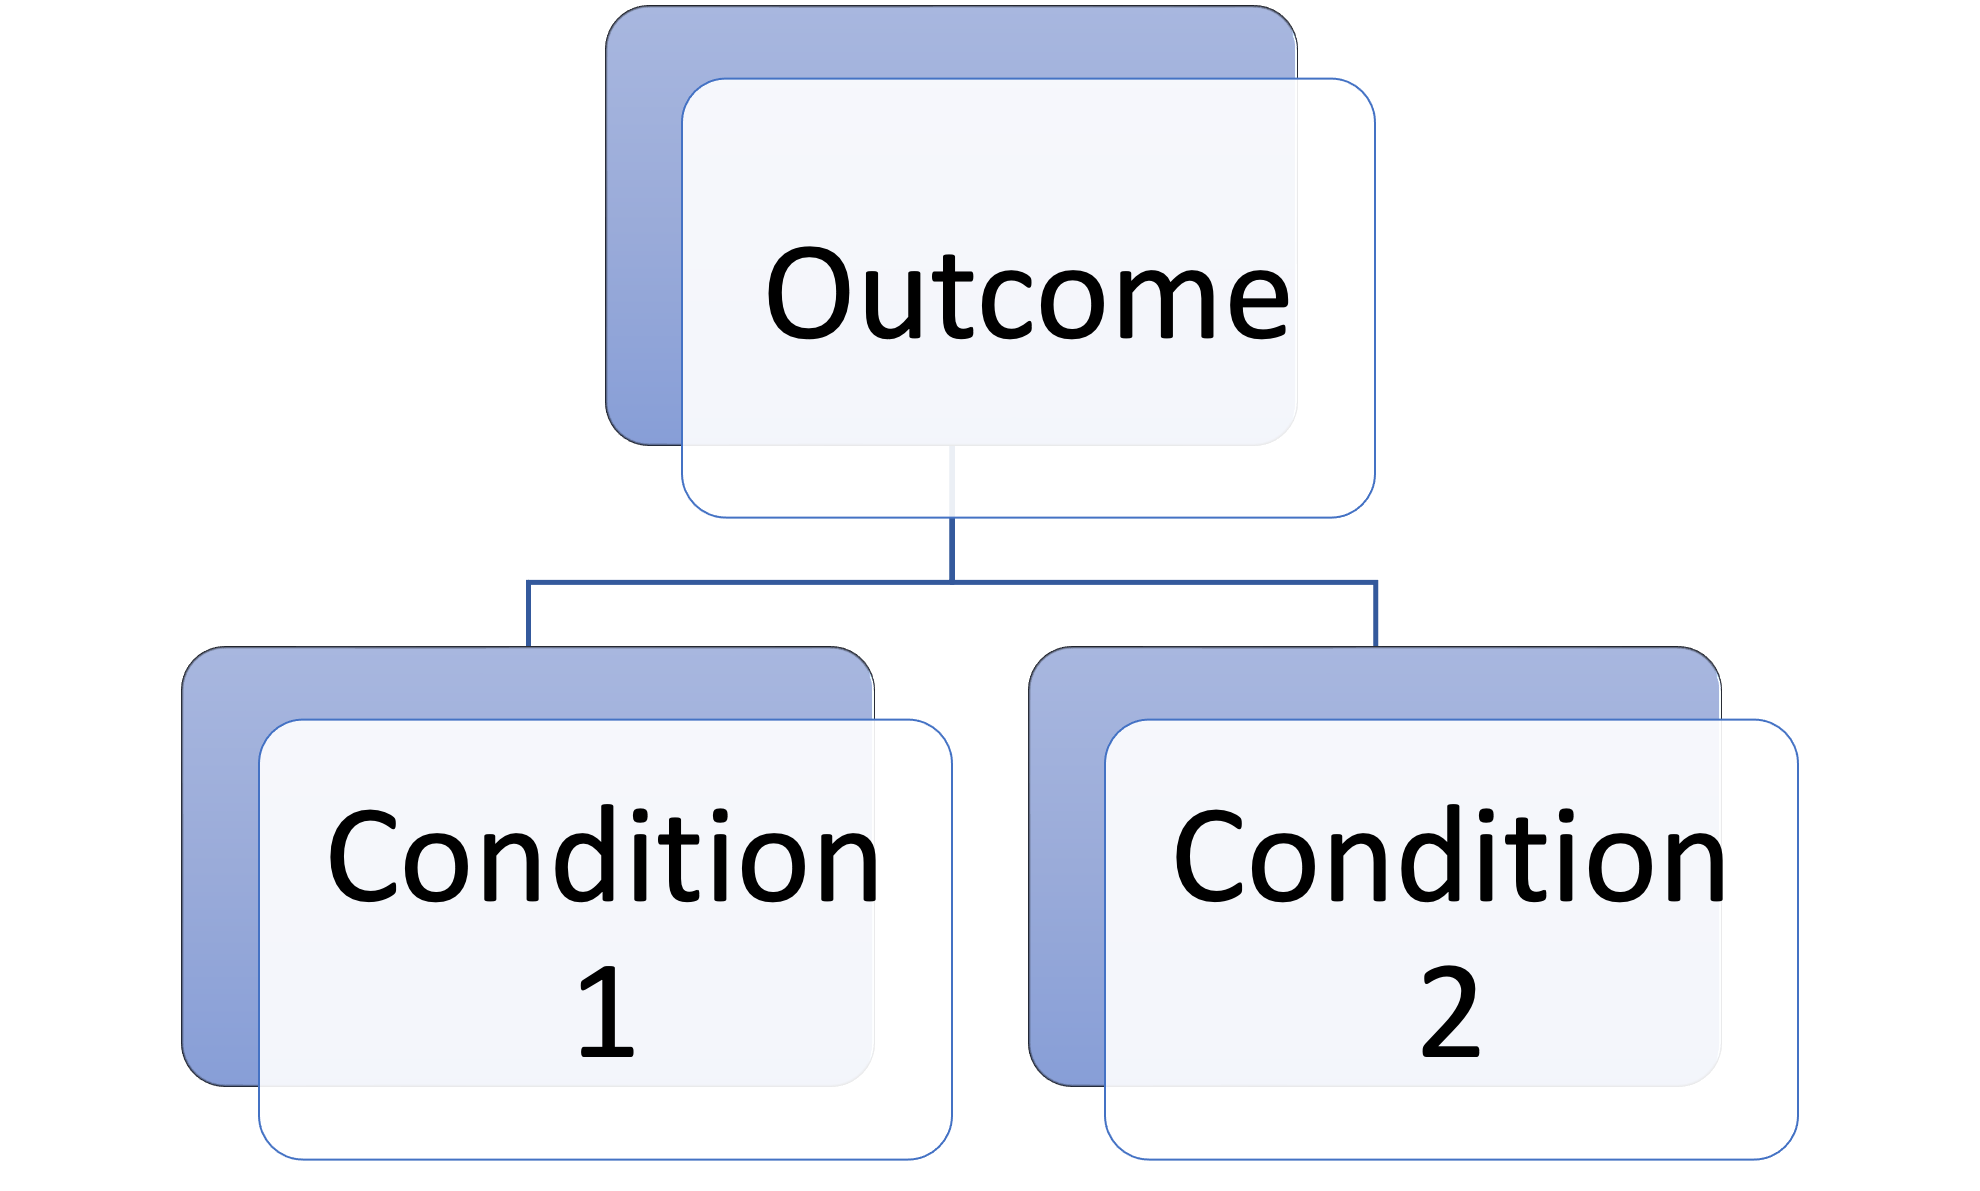
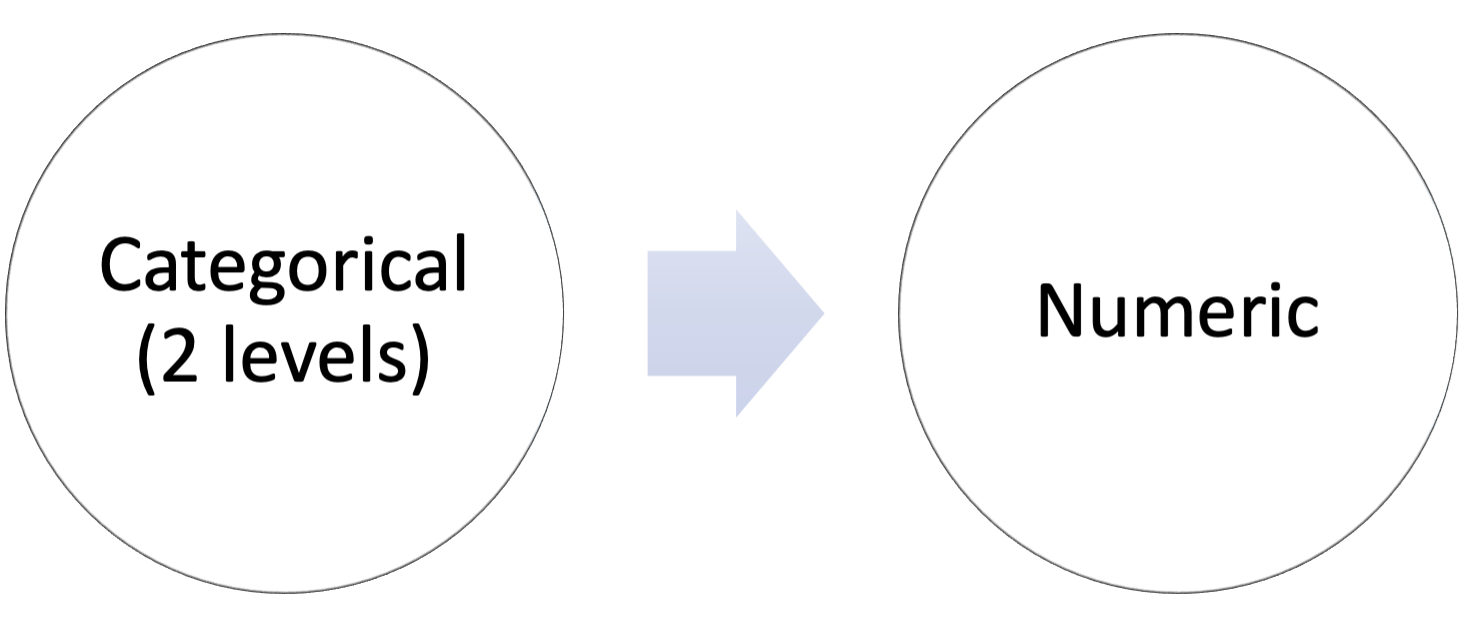
Comparing 2 groups
t-test
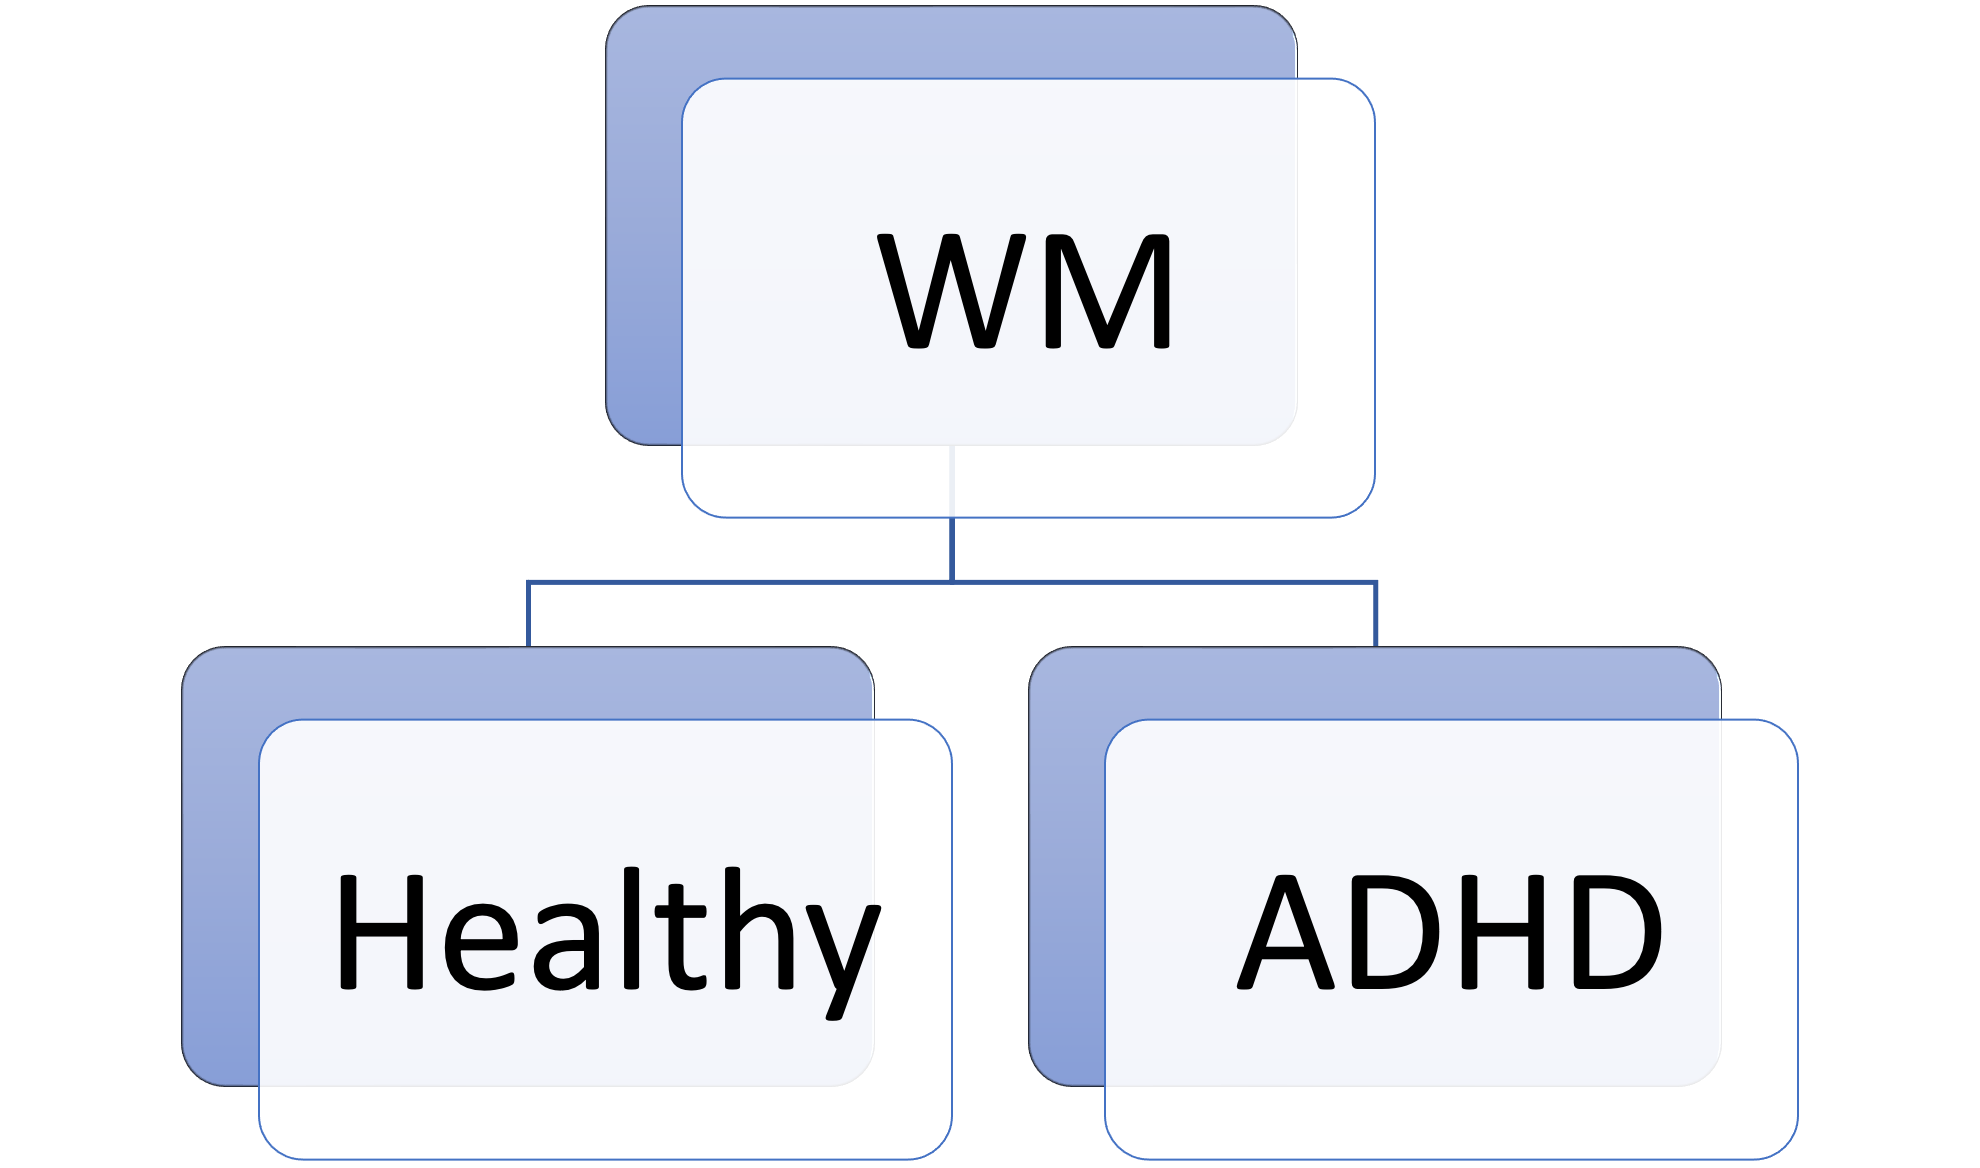
Usefulness
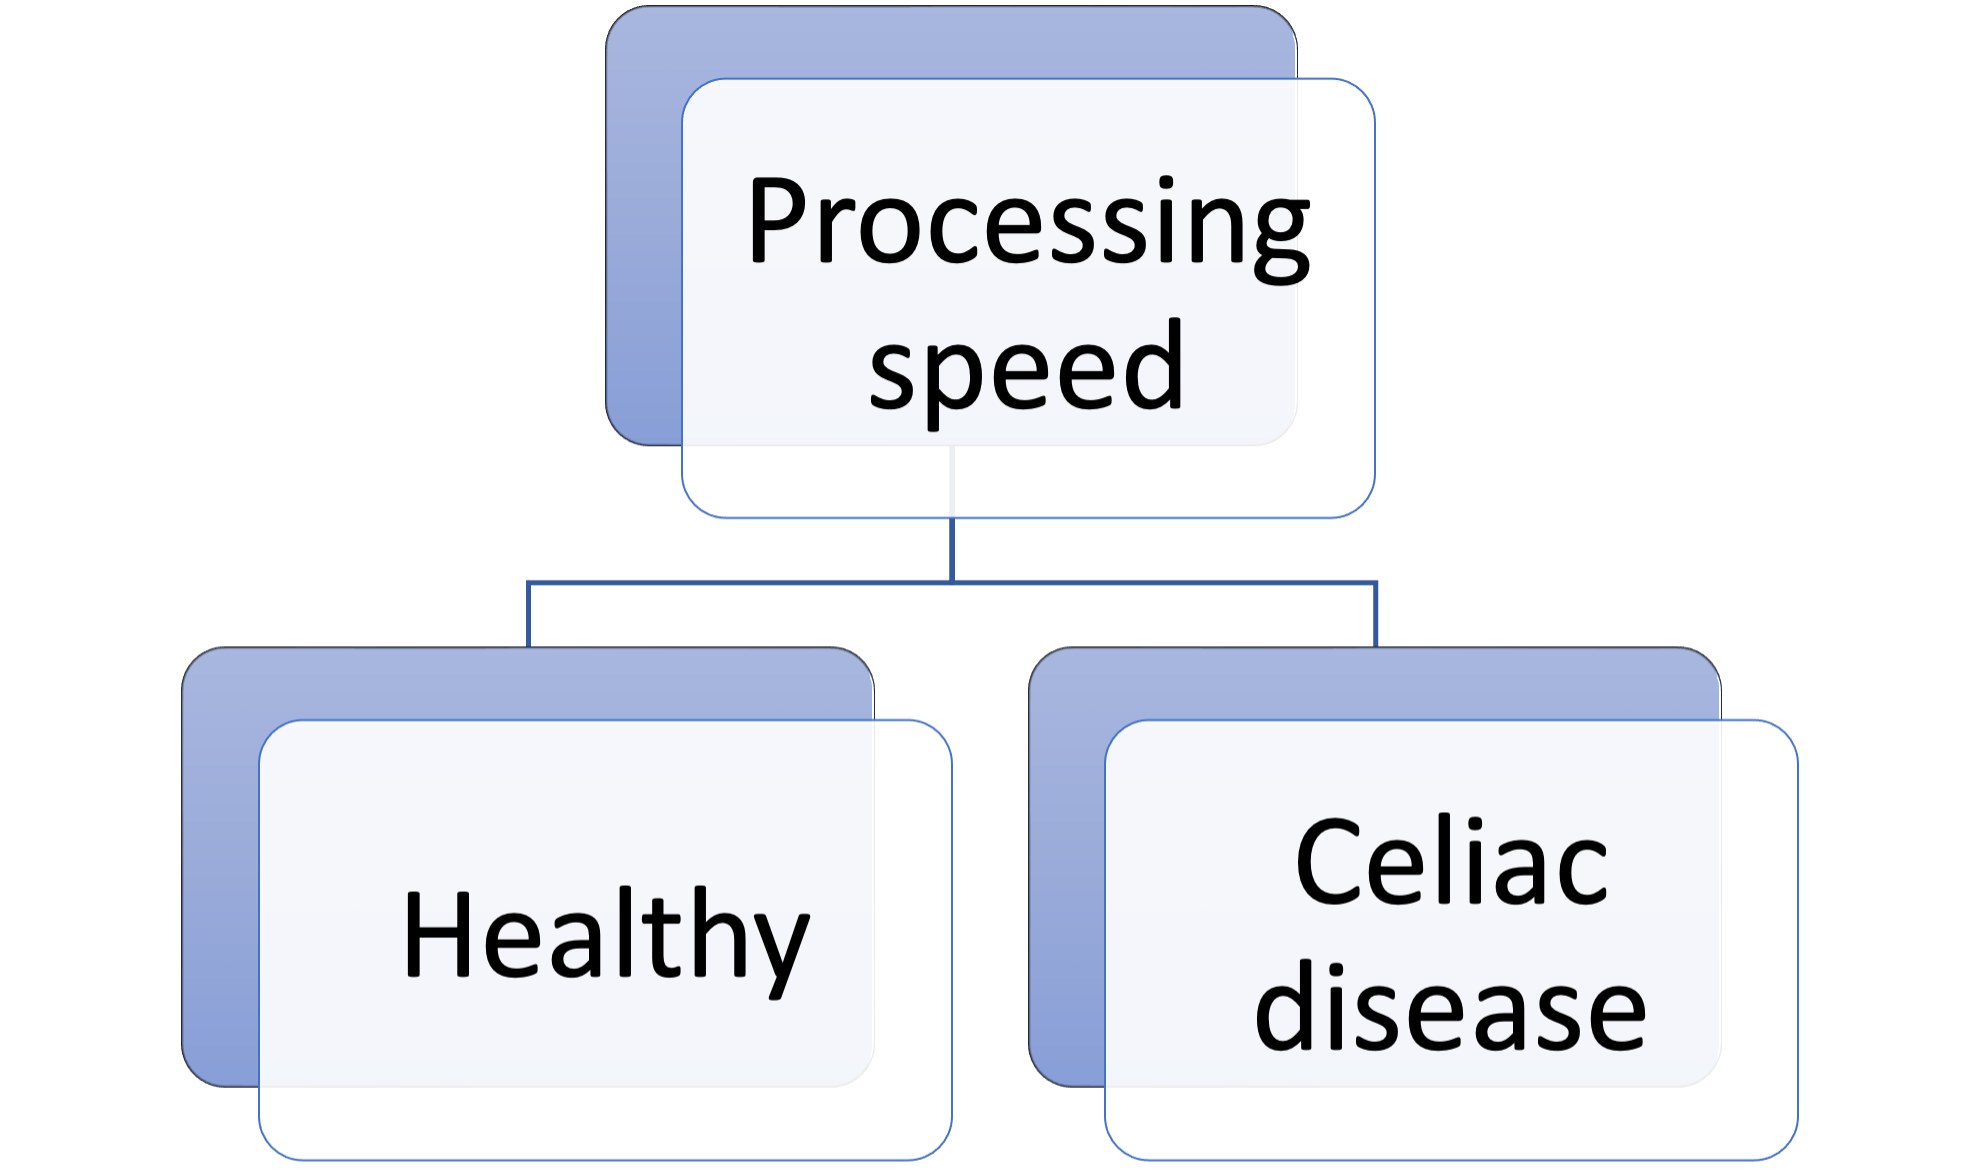
Usefulness
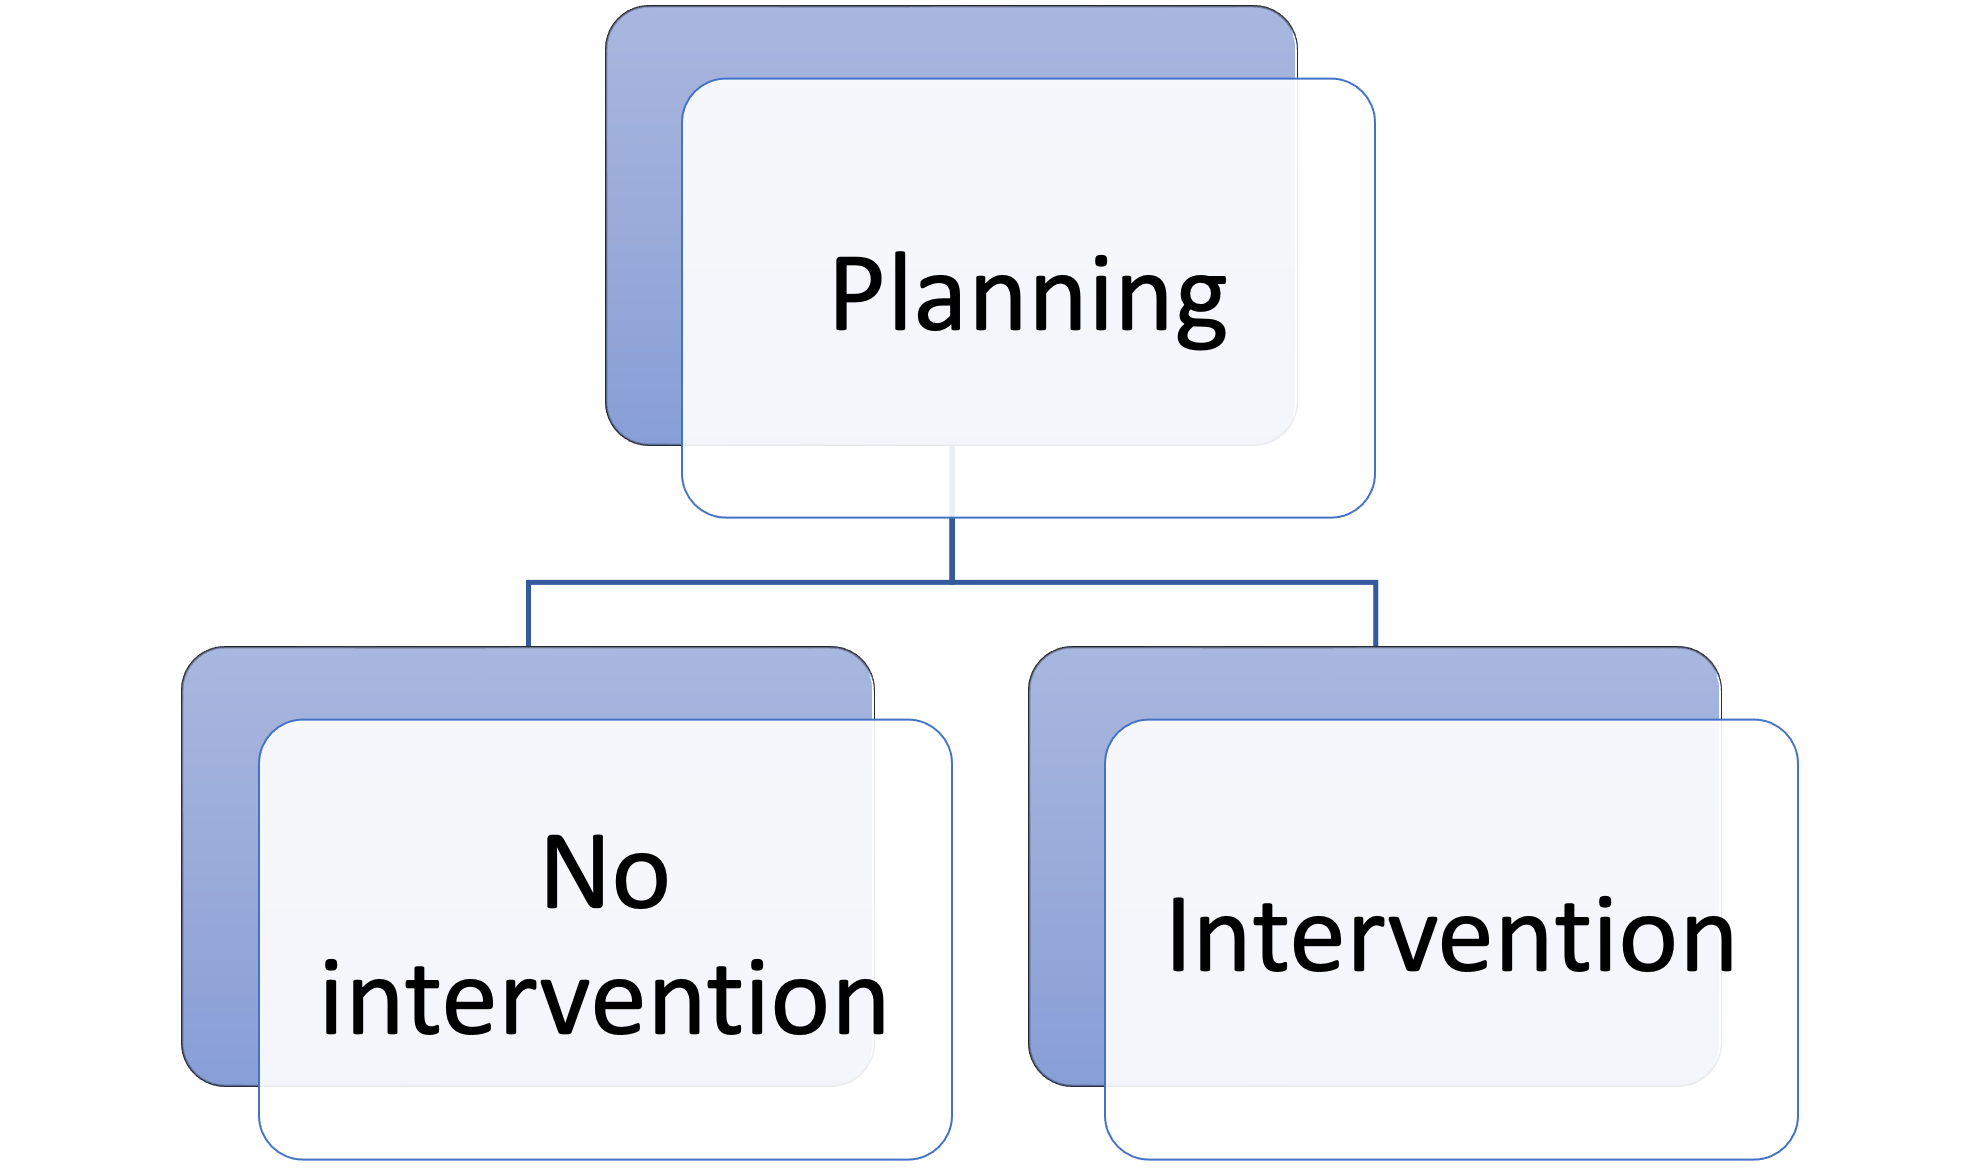
Usefulness
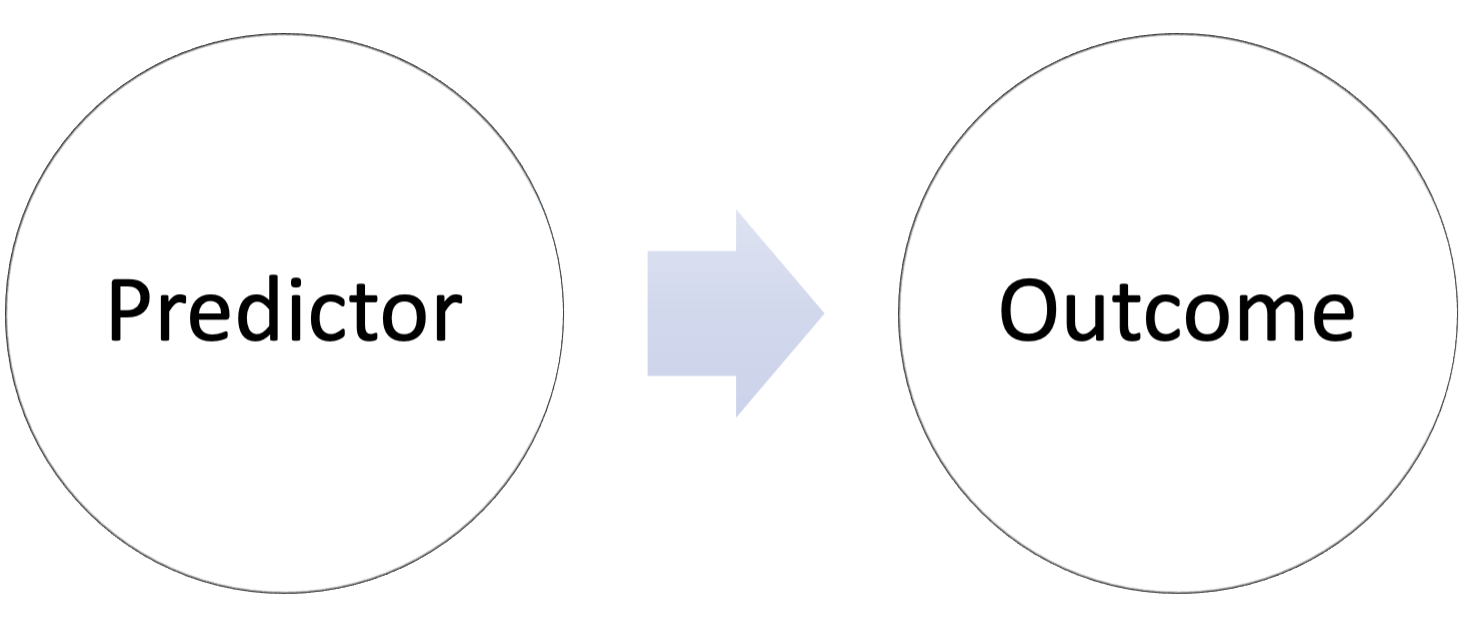
General form
More general
Even more general
GLM form
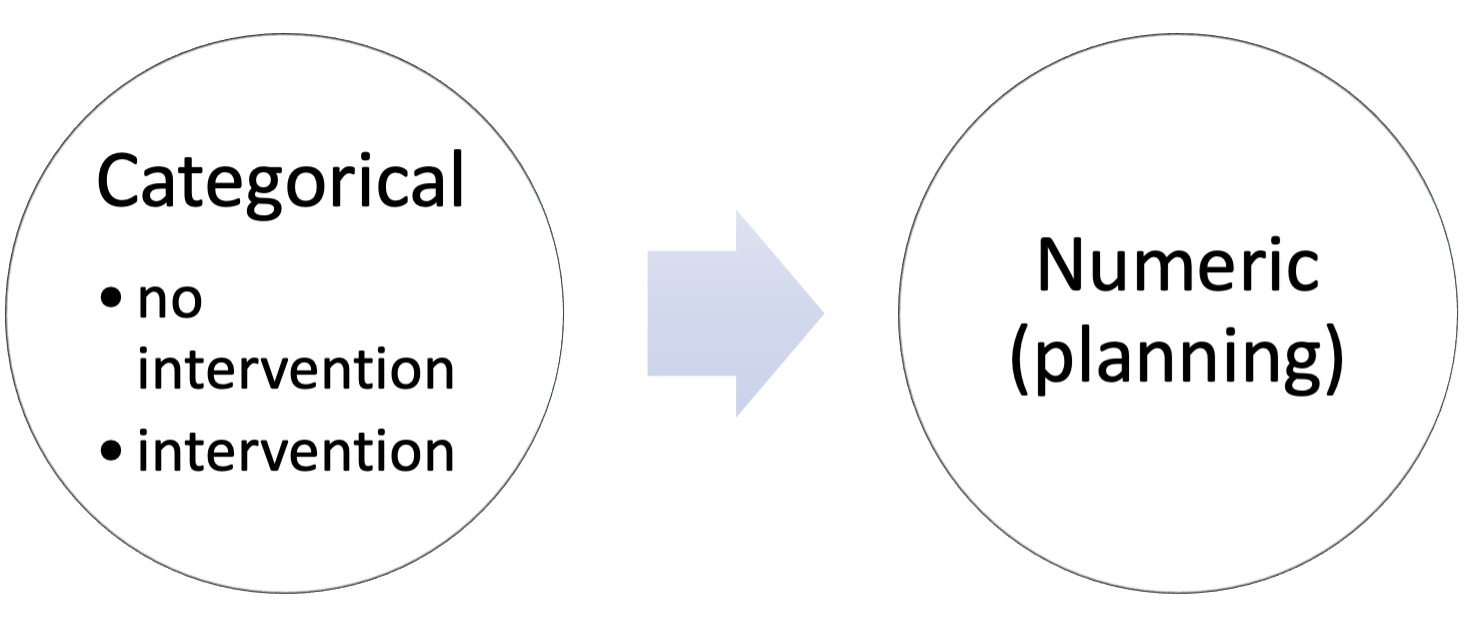
GLM form - examples
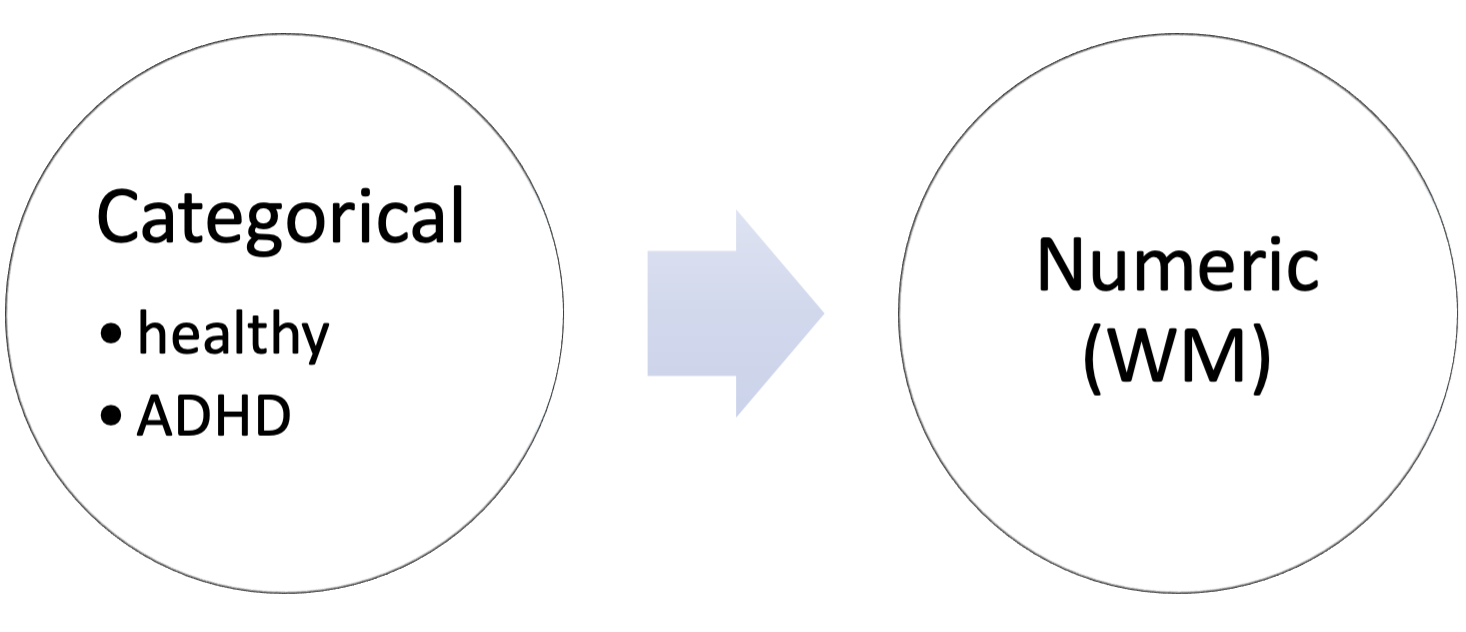
GLM form - examples
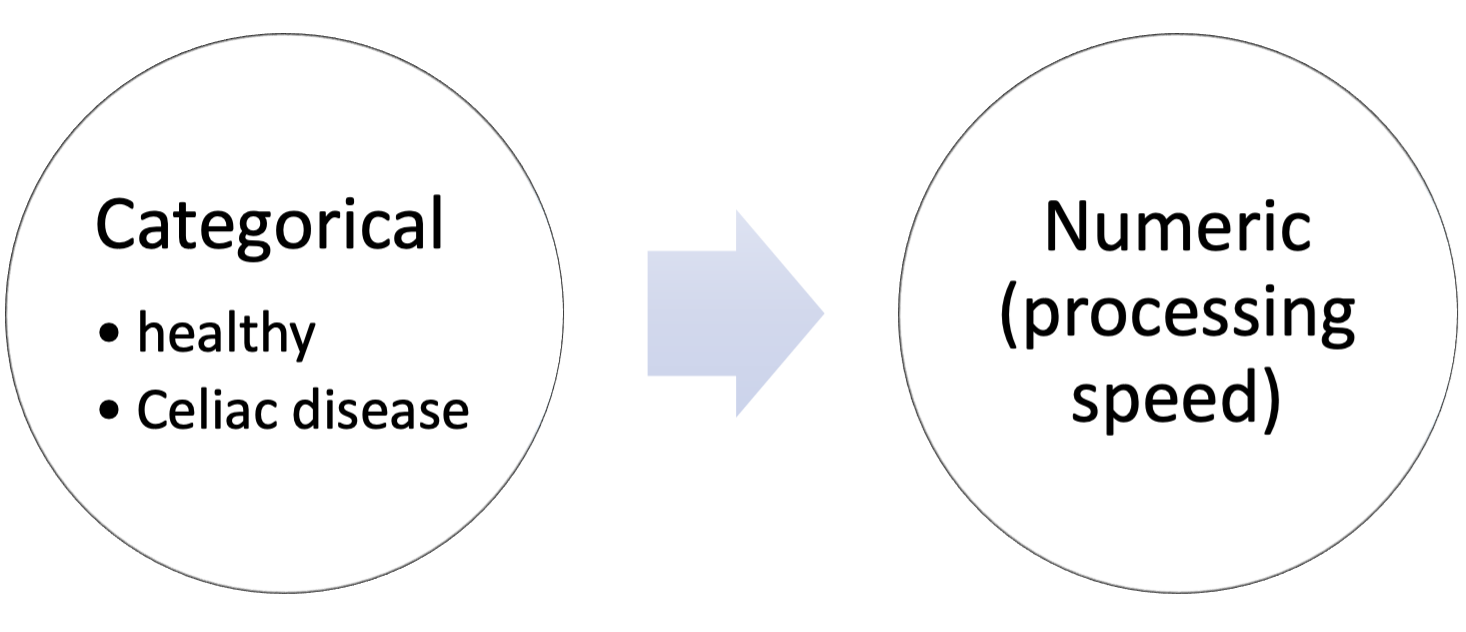
GLM form - examples
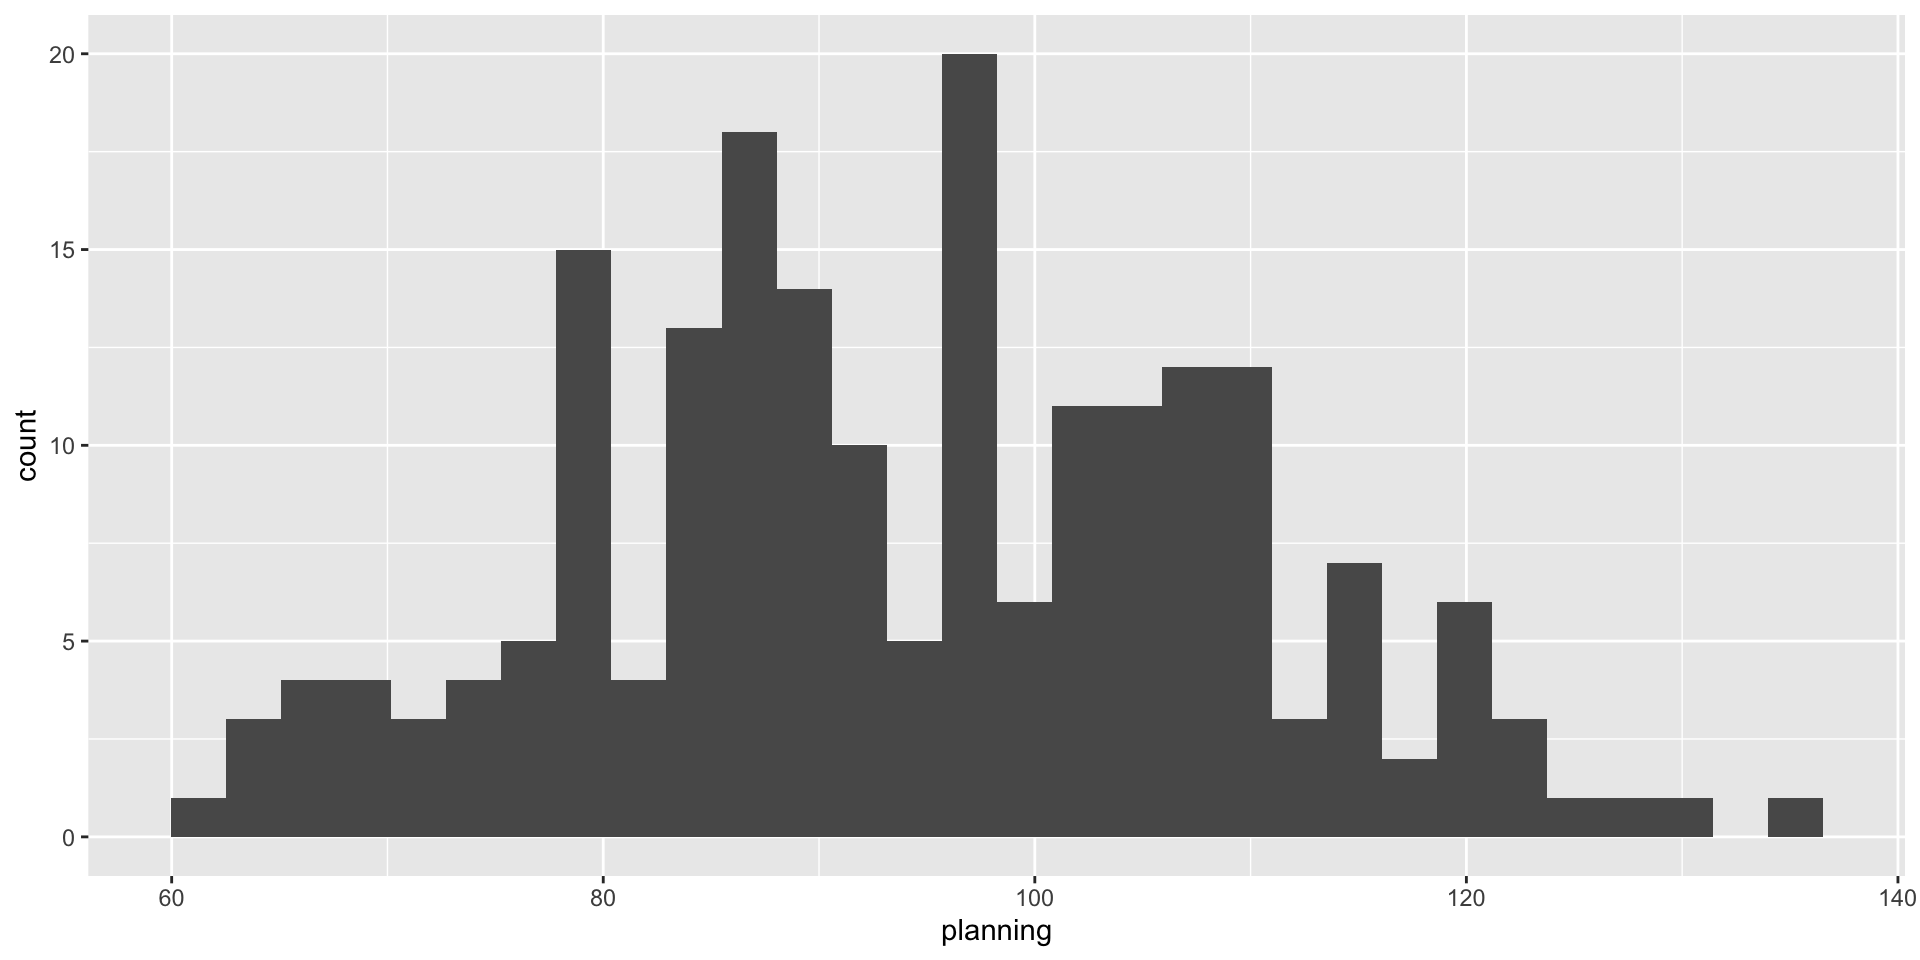
Get data
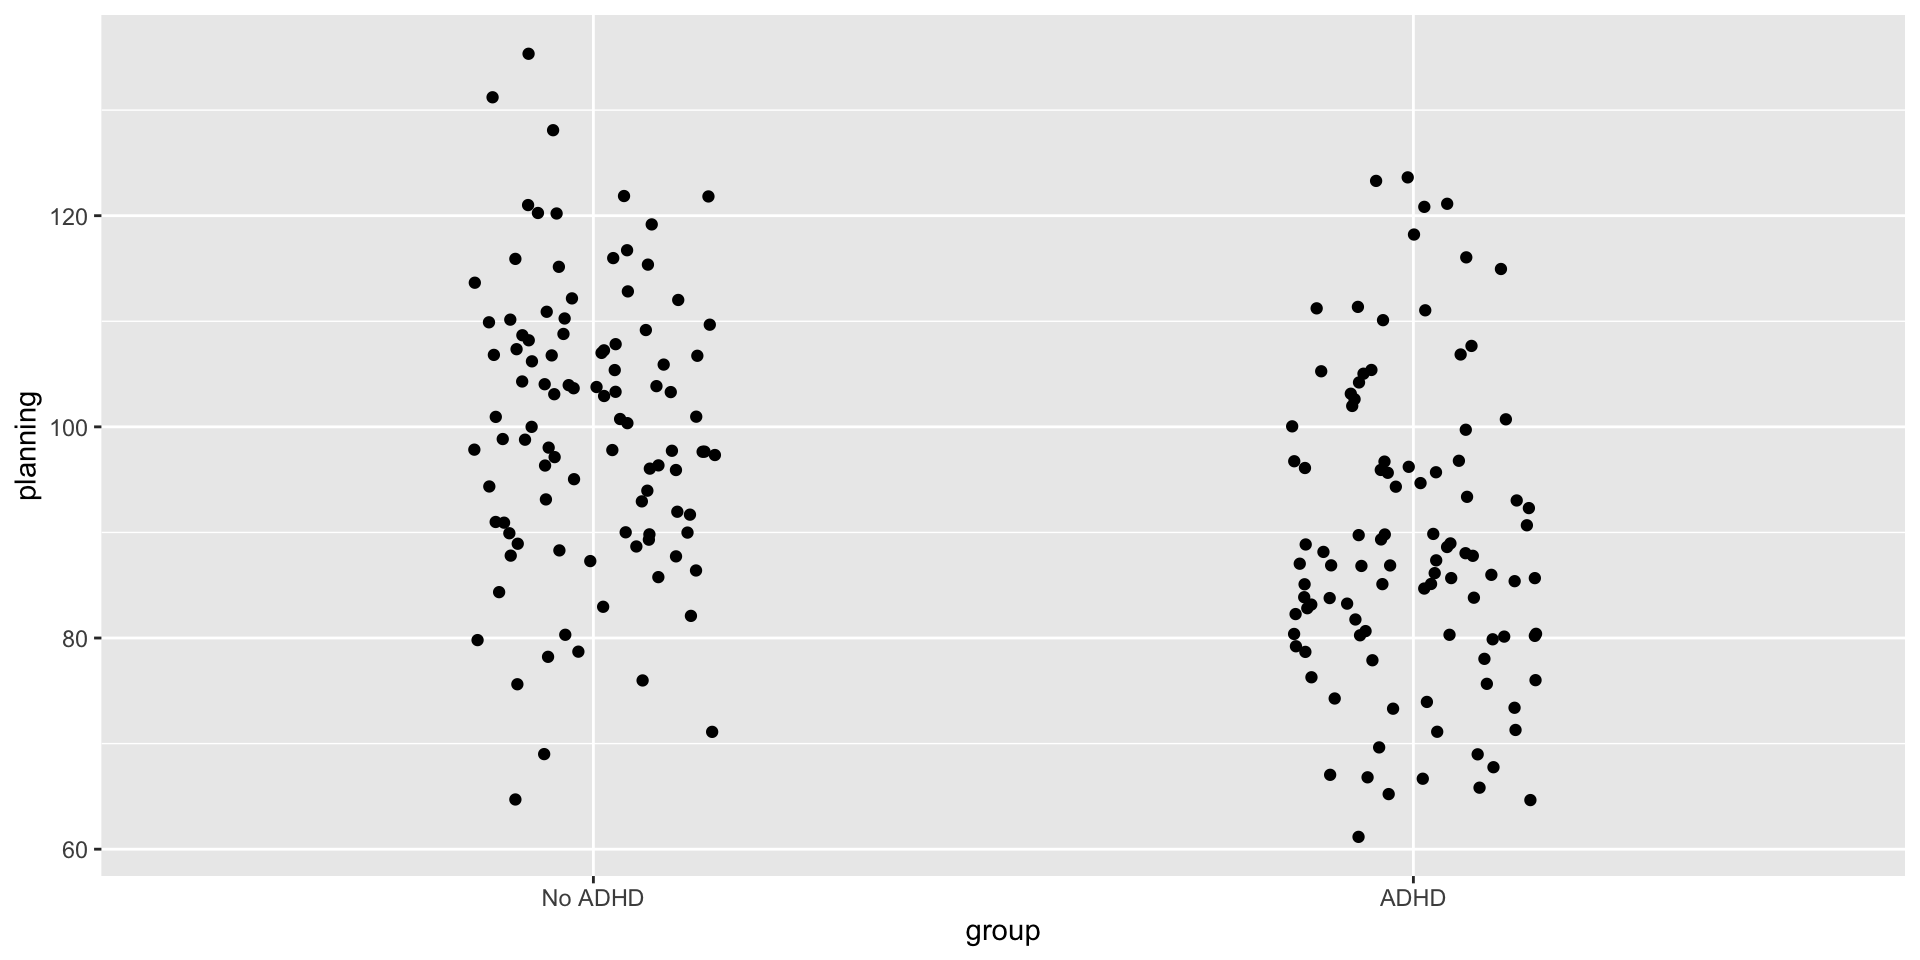
Group data
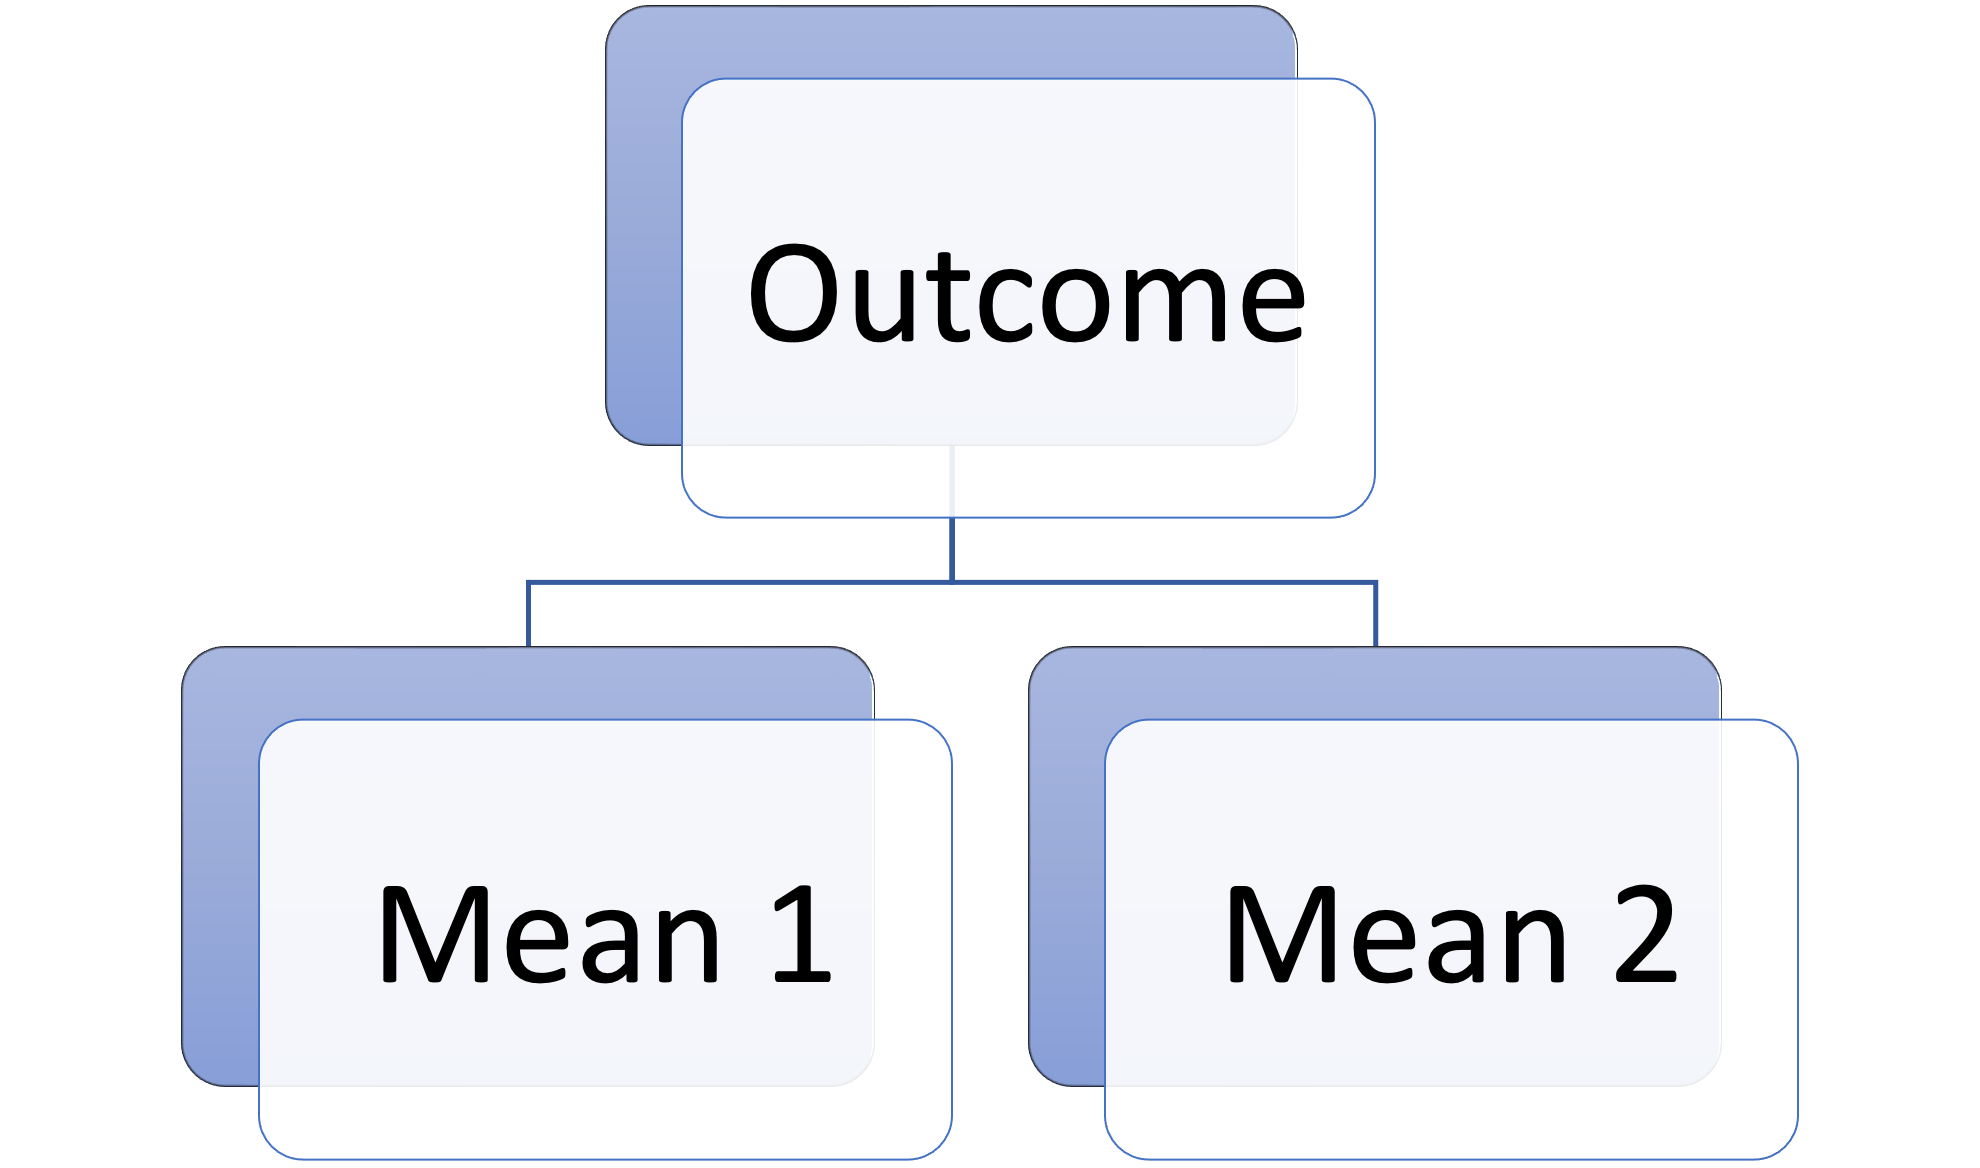
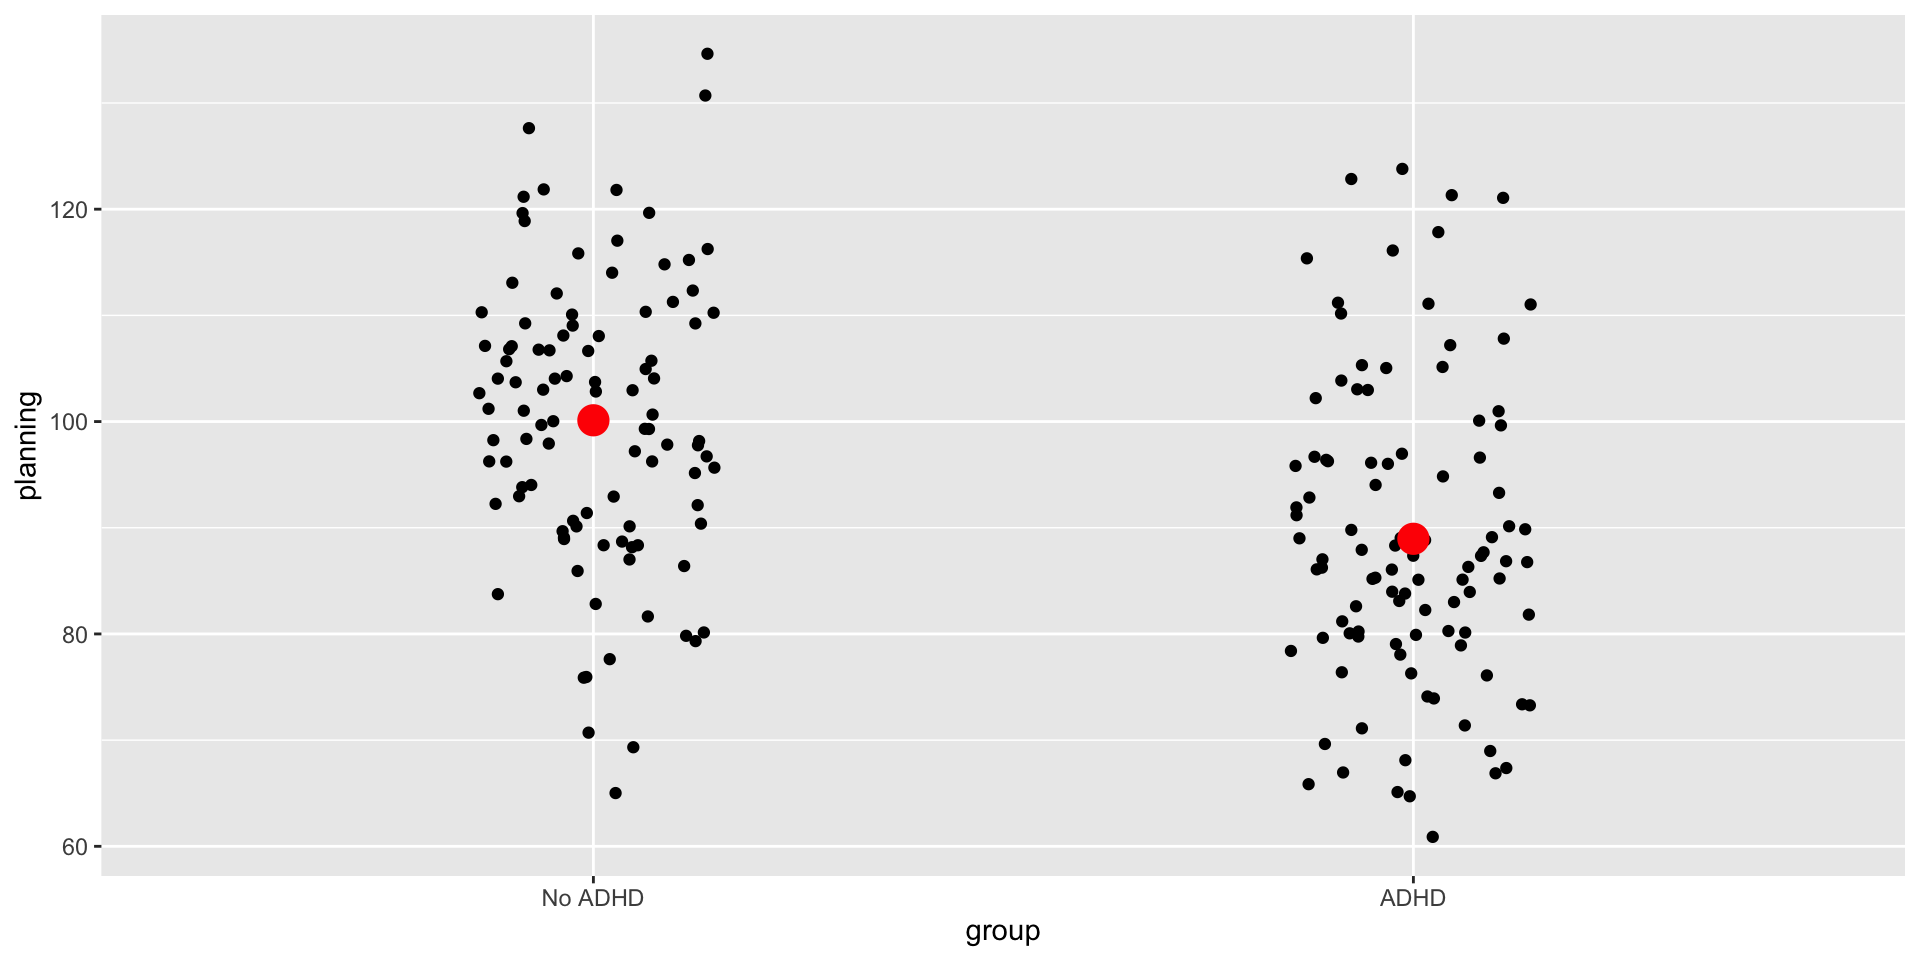
Estimate means
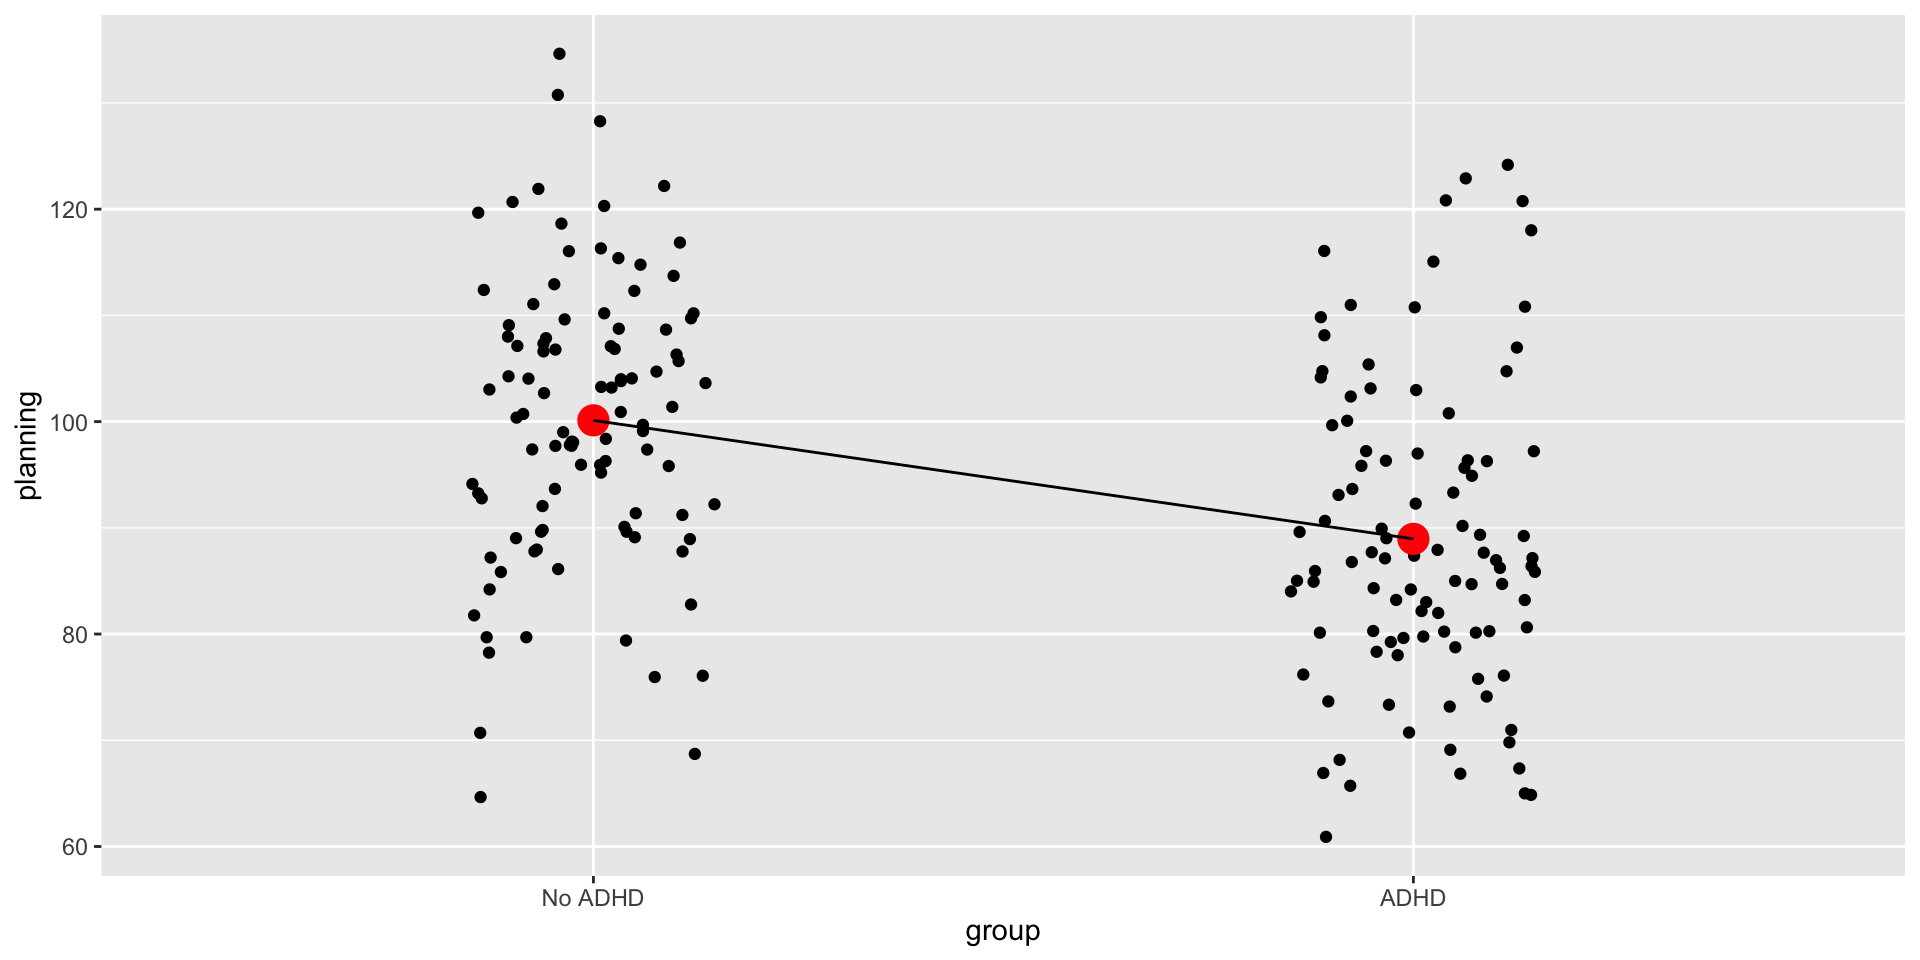
Estimate effect (difference)
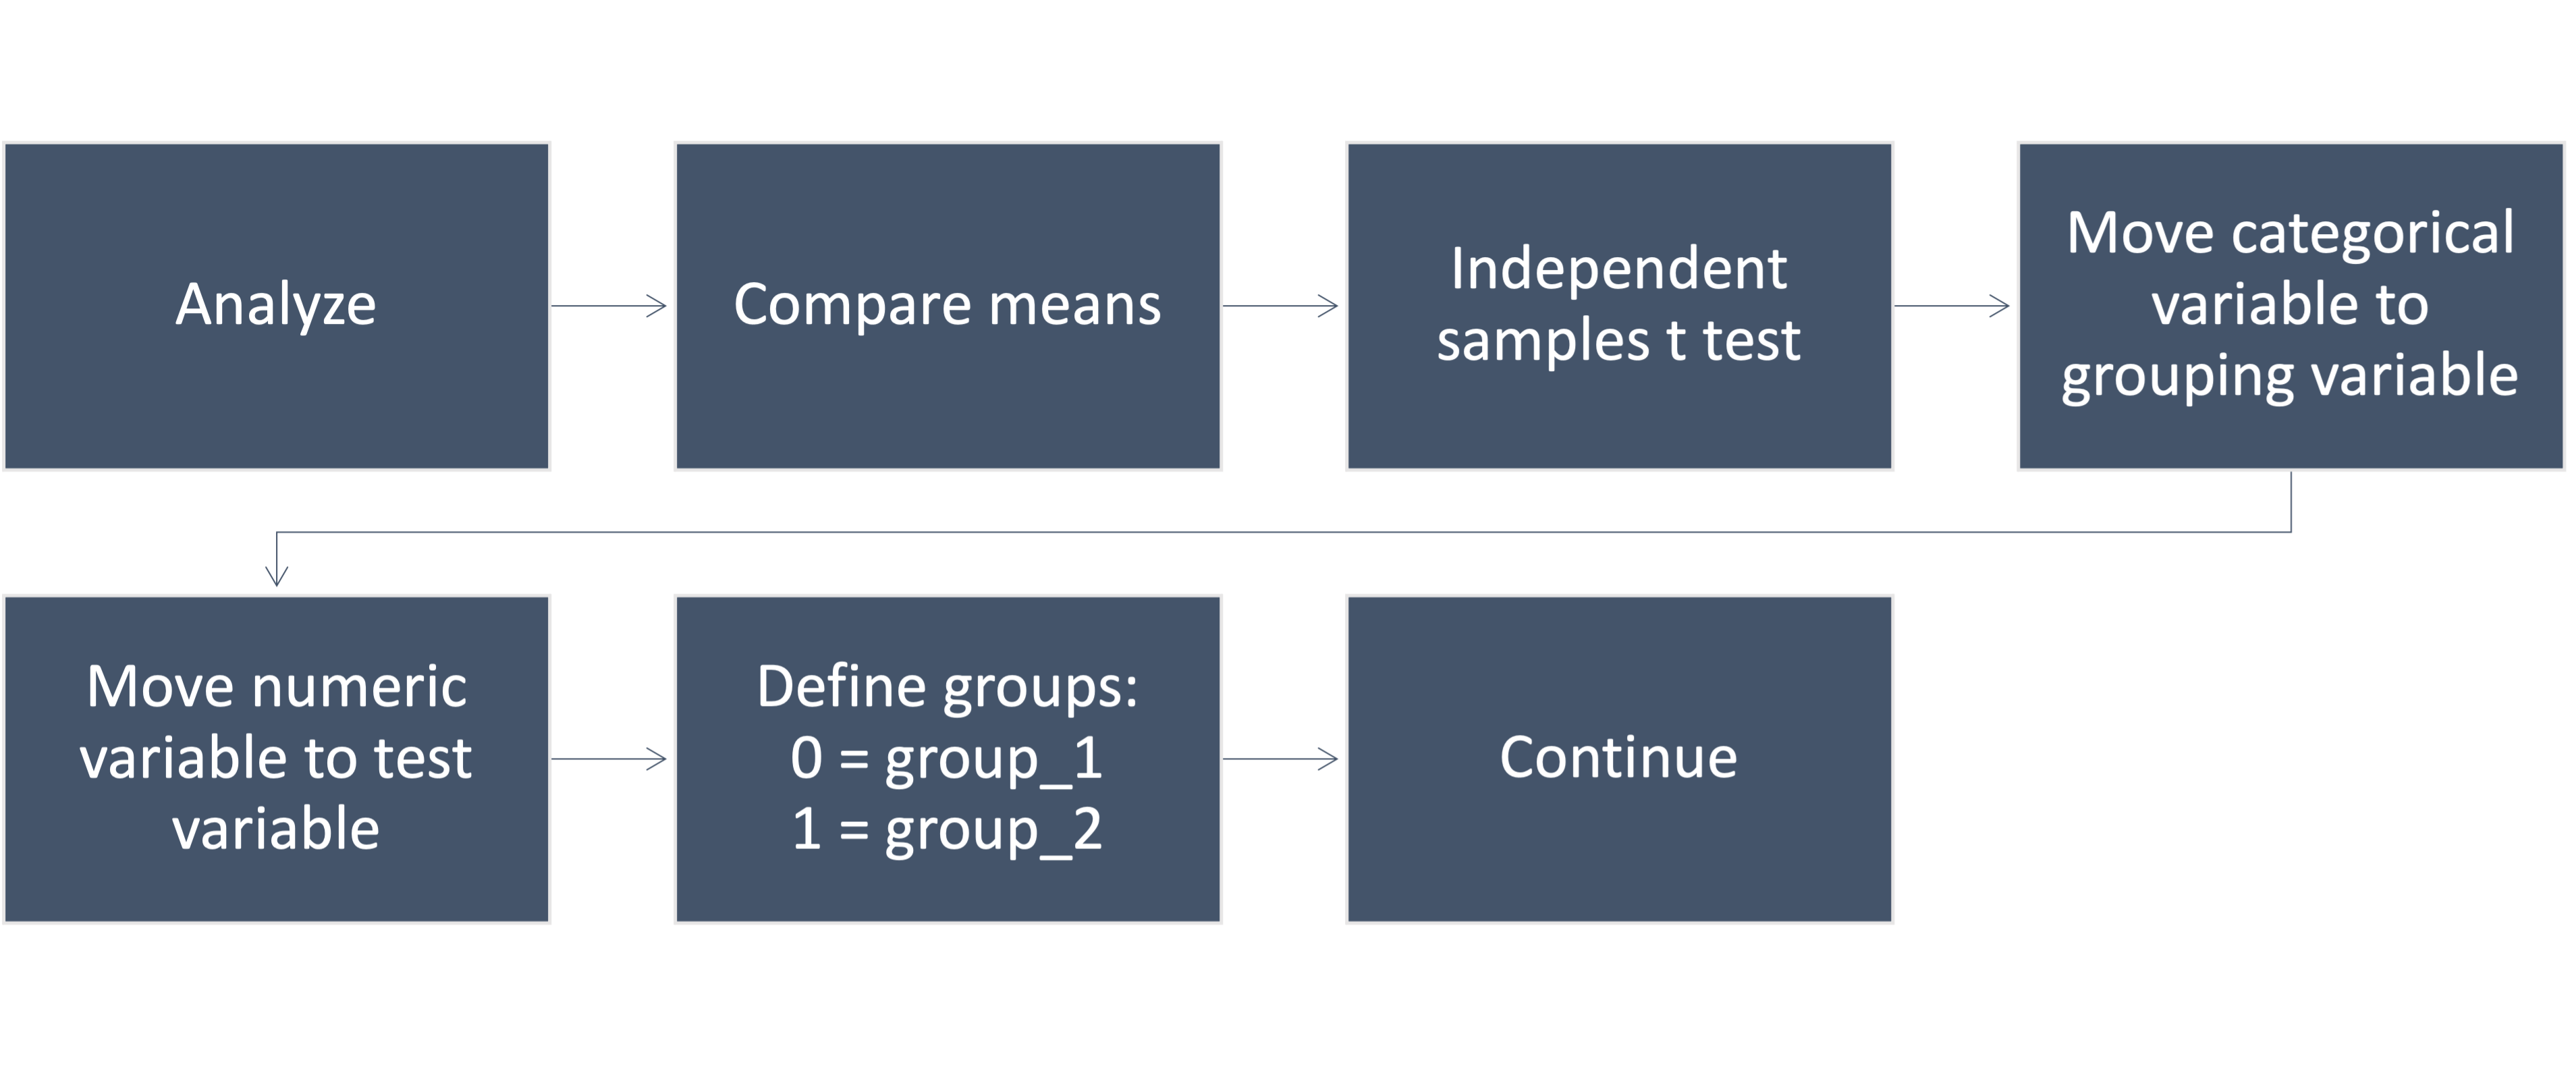
Conducting an independent t-test